You are here
Stellar Populations of Galaxies in the LAMOST Spectral Survey
Based on the LAMOST data, Lili Wang, a PhD candidate from Dezhou University, has led a new study that measured age and metallicity for the stellar populations of about 43,000 galaxies, by using their newly proposed method. The derived results have been included in a LAMOST value-added catalog, enriching the galaxy data of LAMOST.
This work has been published in The Astrophysical Journal Supplement Series.
Galaxies are systems of stars, gas, and dust. A galaxy spectrum in optical wavelength, which is mainly composed of the accumulated light of hundreds of billions of stars, encodes the age and metallicity distributions of stars. From stellar population analysis of galaxy spectra, the star formation and chemical evolution history of galaxies are expected to be decoded.
The common method of stellar population analysis is the template fitting based on full spectrum. However, uncertainties always exist as a result of the inaccuracy of flux calibration or high dust density of galaxies.
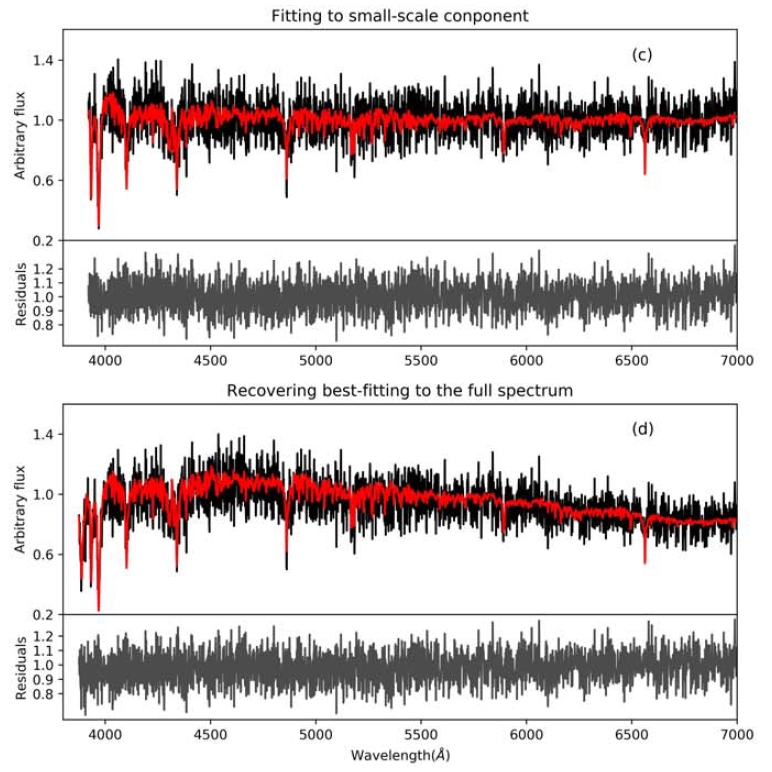
In this work, the researchers proposed a template fitting method based on small-scale features to estimate the average age and metallicity of LAMOST galaxies. This new method separates the small-scale features, namely the absorption features, from the large-scale components in the galaxy spectra, and only fit the observed small-scale features with models, which is not affected by the global shape of the continuum.
Several tests and comparisons have been made, and the results prove the properties derived by this method are reliable. One important advantage of this method is that it is suitable for the stellar population analysis of galaxies with uncertain flux calibration or spatially non-uniform dust attenuation, which is difficult in classic methods.
This work provides the first estimation of the age and metallicity for galaxies in the LAMOST spectroscopic survey, which will play an important role in the study of the physical properties of the low redshift galaxies and galaxy systems.
The paper is available at https://iopscience.iop.org/article/10.3847/1538-4365/ac3241.

Figure 1: Example of a piece of mock spectrum well fitted by the reconstructed full model spectrum based on the small-scale features. (Credit: Lili Wang)
